Getting Started with Visualization
The goal of this guide is for you to collect and visualize some IoT device data using Tempus Cloud. This guide will help you with:
- Provisioning a device
- Manage device credentials
- Push data from a device to the Tempus cloud instance using MQTT
- Create a dashboard to visualize the data
Setup and Requirements
If you don’t have access to a running Tempus Cloud instance please follow this guide:
Make sure you have created a tenant by following this guide:
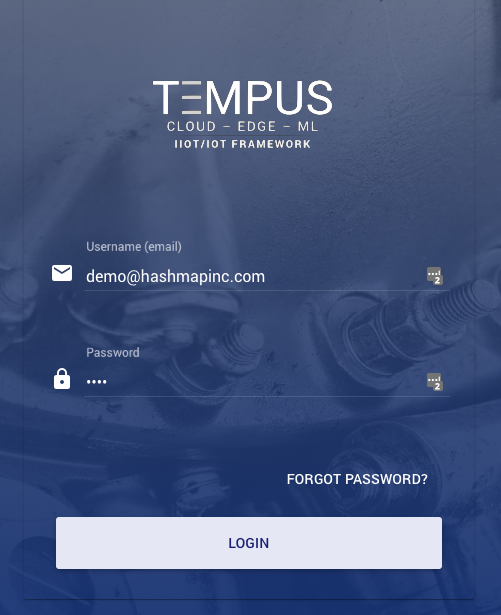
Login as the tenant administrator
The first step is to login into administration Web UI. If you are using local Tempus cloud installation you can login to administration Web UI using the account you created in the quickstart guide for creating a tenant.
Provision your Device
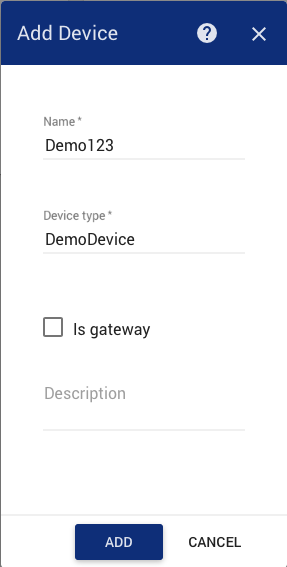
- Open the Devices panel and click on the “+” button at the bottom-right corner of the page.
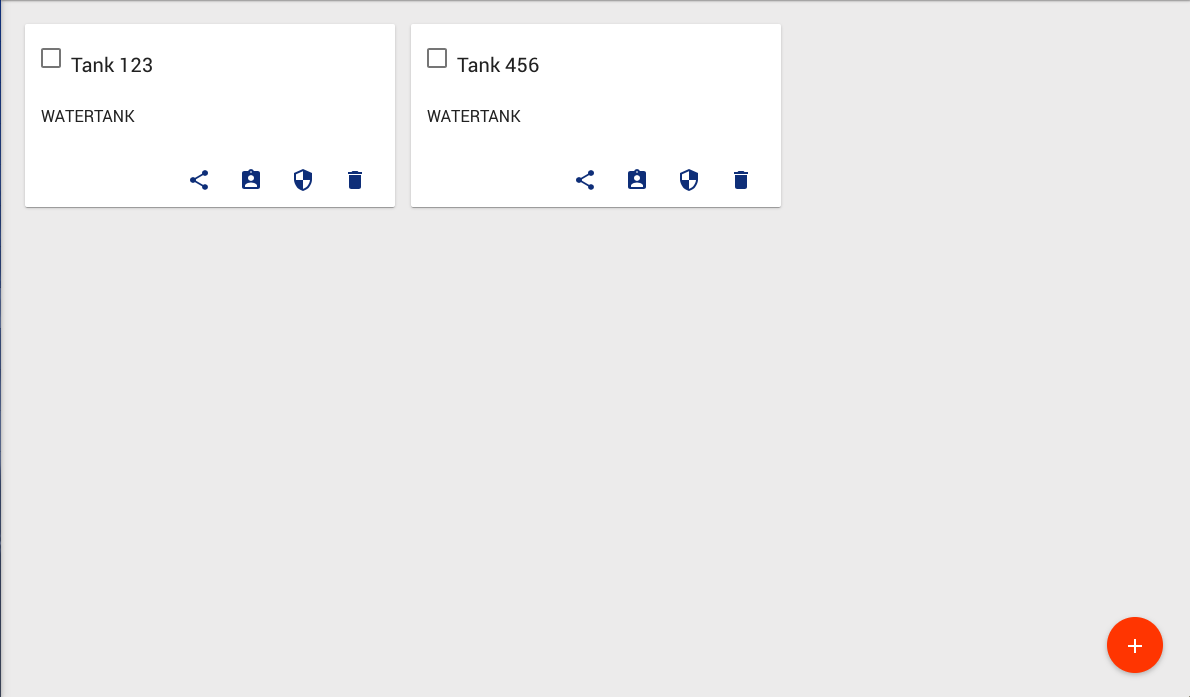
- Populate and save device name (for example, “SN-001”). It will be referred to later as $DEVICE_NAME. Device names must be unique. Populating device name based on a unique serial number or other device identifier is generally a good idea. Click “Add” button will add corresponding device card to the panel.
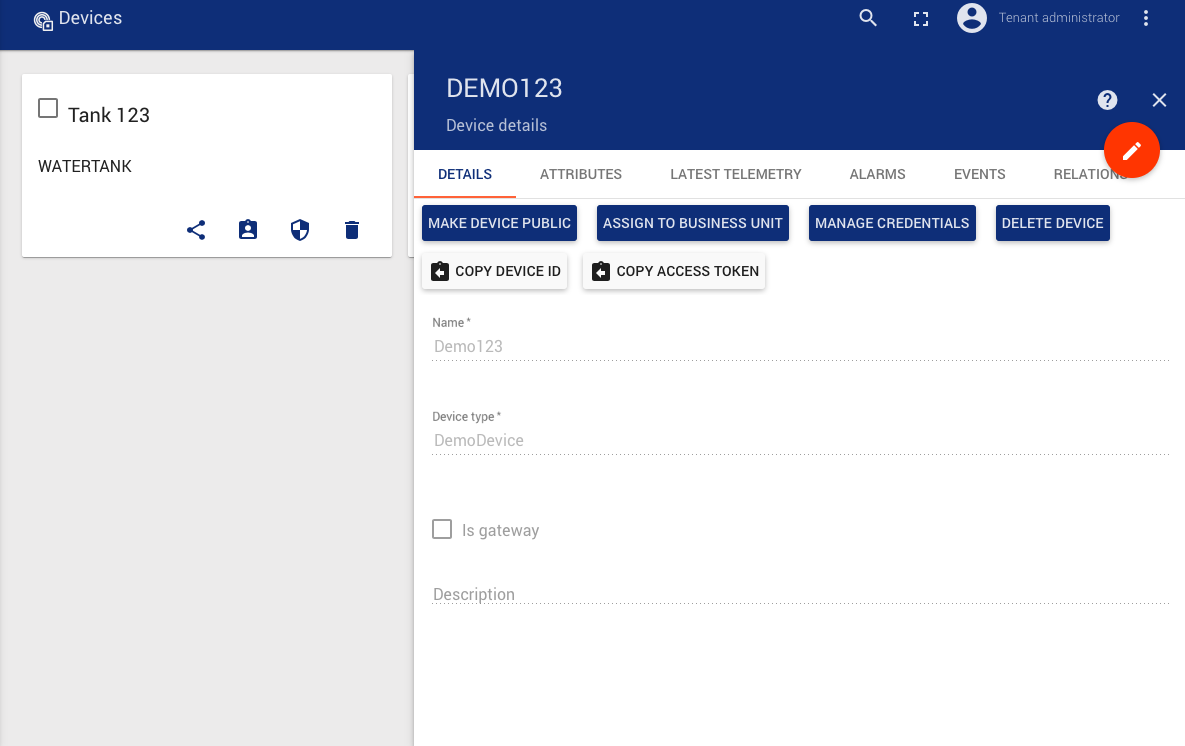
Manage device credentials
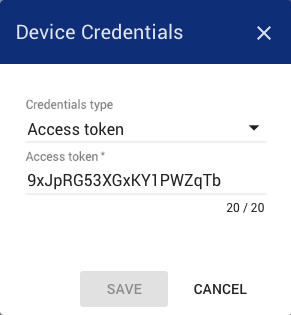
1. Click on the device card created in the previous step. This action will open “device details” panel. Click on the “manage credentials” button on the top of the panel. This action will open a popup window with device credentials.
- Device credentials window will show auto-generated device access token that you can change. Please save this device token. It will be referred to later as $ACCESS_TOKEN
Pushing Data From the Device - Nifi
Attributes
- Navigate to a running instance of Apache Nifi
- Add a Publish MQTT processor to the Canvas
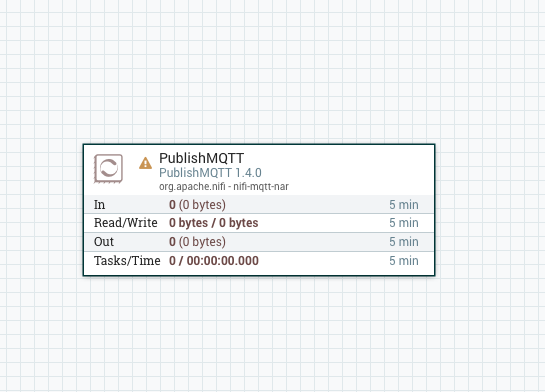
- Right-click on the PublishMQTT processor and click configure, then click on the Properties tab
- Fill in the information as follows
- For the Broker URI put in tcp://host_ip:1883 (1883 is the default mqtt port)
- For the Client ID enter nifi
- For the User Name enter the $ACCESS_TOKEN that was created earlier
- For the password enter a space character
- For the Topic use v1/devices/me/attributes
- For the QoS enter 0
- For Retain Message enter false
- Click on settings and tick the boxes to auto-terminate the failure and success relationships, as this is the last processor in the flow, and click Apply
- Add a GenerateFlowFile processor to the Canvas
- Right-click on the GenerateFlowFile processor and click configure, then click on the Properties tab
- Fill in the information as follows
- For Custom Text Enter: {“firmware_version”:”1.0.1”, “serial_number”:”SN-001”}
- Click on the Scheduling tab
- Enter 1 sec for the Run Schedule
- Click Apply
- Start both Processors
- Navigate to the Tempus Devices panel
- Click on the device card that you published data to
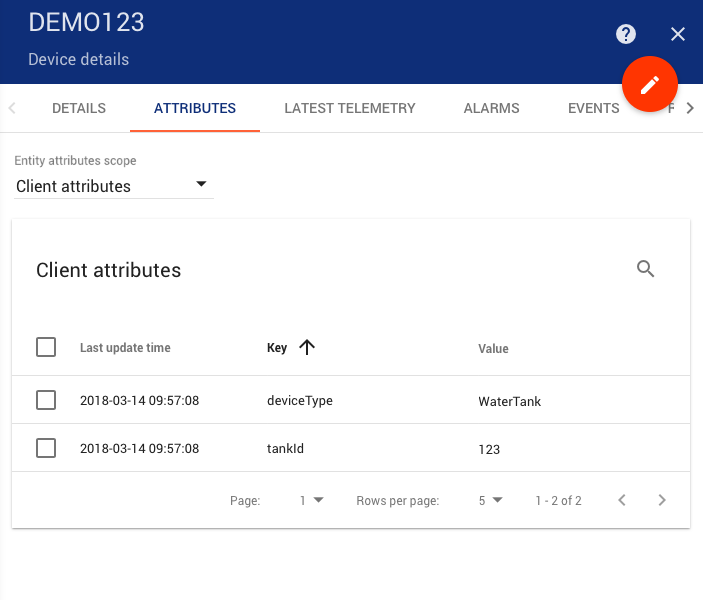
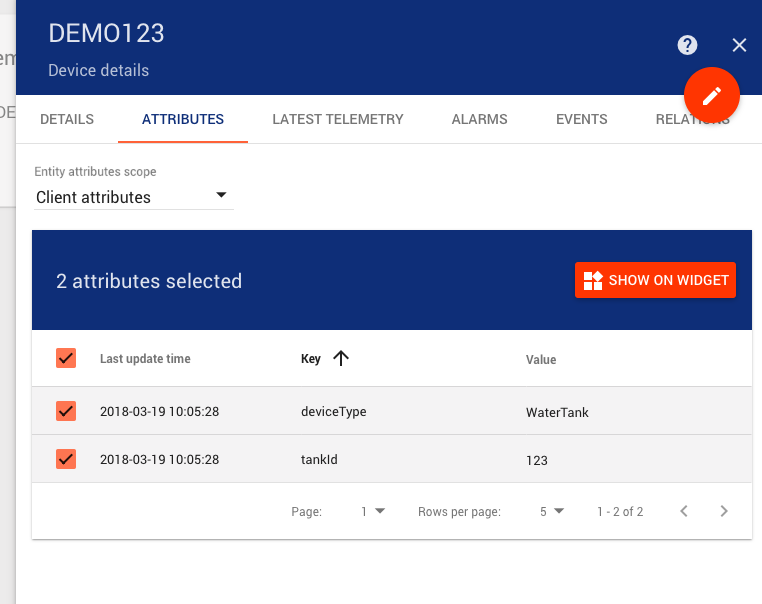
- Click on attributes
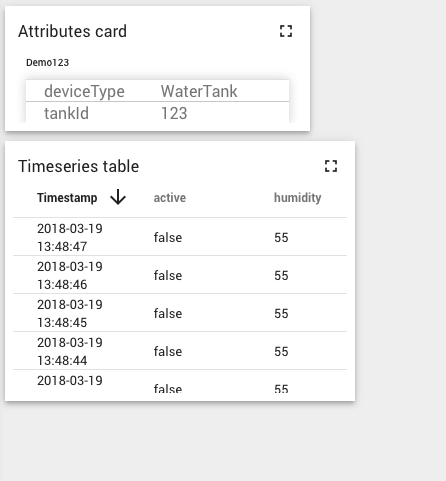
- You should see the 2 attributes appear in the pane as below:
Telemetry
- Navigate to a running instance of Apache Nifi
- Add a Publish MQTT processor to the Canvas
- Right-click on the PublishMQTT processor and click configure, then click on the Properties tab
- Fill in the information as follows
- For the Broker URI put in tcp://host_ip:1883 (1883 is the default mqtt port)
- For the Client ID enter nifi
- For the User Name enter the $ACCESS_TOKEN that was created earlier
- For the password enter a space character
- For the Topic use v1/devices/me/telemetry
- For the QoS enter 0
- For Retain Message enter false
- Click on settings and tick the boxes to auto-terminate the failure and success relationships, as this is the last processor in the flow, and click Apply
- Add a GenerateFlowFile processor to the Canvas
- Right-click on the GenerateFlowFile processor and click configure, then click on the Properties tab
- Fill in the information as follows
- For Custom Text Enter: {“temperature”:21, “humidity”:55.0, “active”: false}
- Click on the Scheduling tab
- Enter 1 sec for the Run Schedule
- Click Apply
- Start both Processors
- Navigate to the Tempus Devices panel
- Click on the device card that you published data to
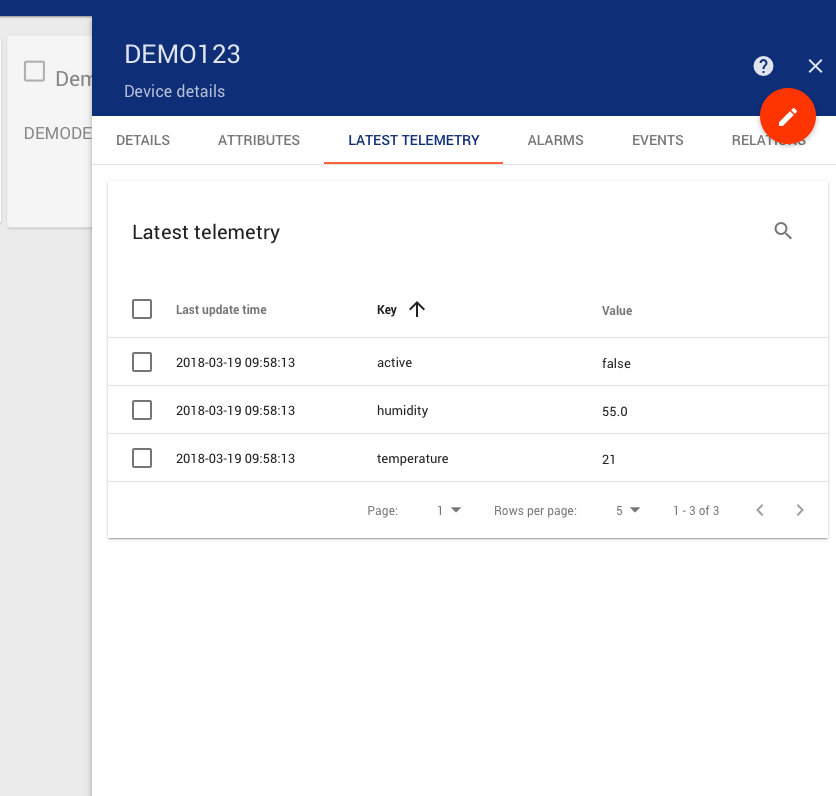
- Click on Latest Telemetry
- You should see the 2 attributes appear in the pane as below:
Observe device data on the Web UI
Create A New Dashboard to Visualize the Data
Attributes
The easiest way to create new dashboard is to select device attributes and show them on widget.
Once you click on “Show on widget” button, you will see a “widget preview” panel where you can
- Select widget bundle
- Select preferred widget
- Add widget to new or existing dashboard
Select the Widget Bundle Cards and click the > until you get to the Attributes Card as shown below

Click Add to Dashboard
Select Create New Dashboard
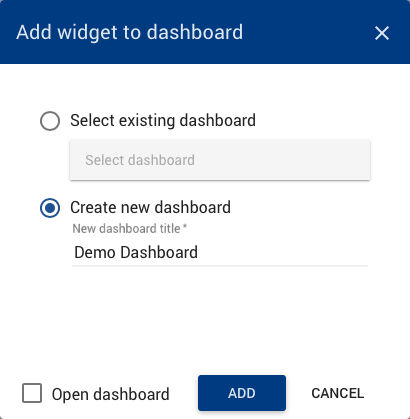
Type in the title Demo Dashboard and click ADD
Next we will add some of the telemetry data as well.
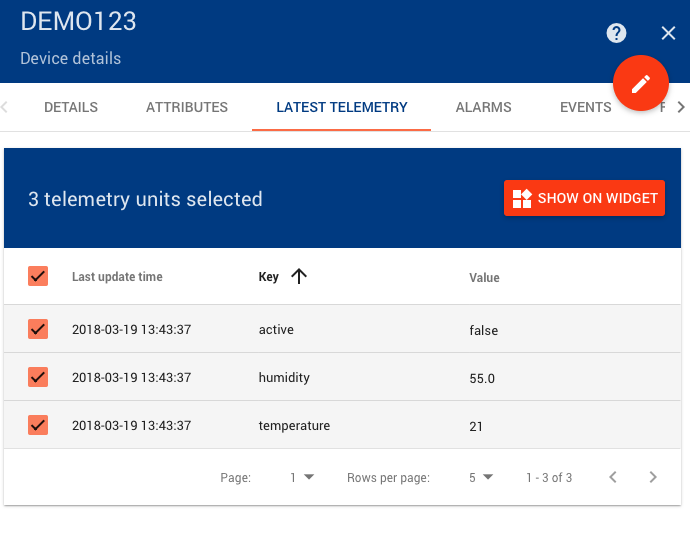
Click on the Latest Telemetry tab
Select the Telemetry values that you would like to monitor on the dashboard and click Show on Widget
Under Cards choose Time Series Table
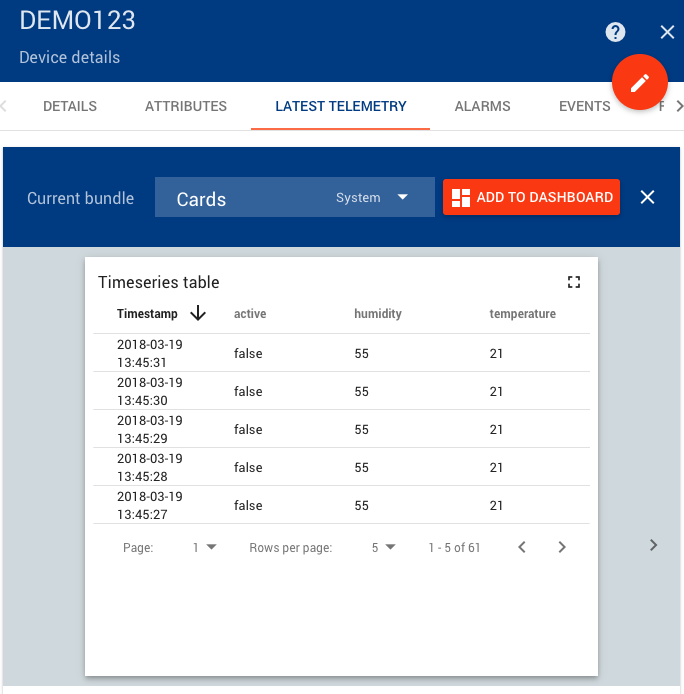
Click Add to Dashboard
This time select Select Existing Dashboard
Click in the box that says Select Dashboard and choose the Demo Dashboard that we created above.
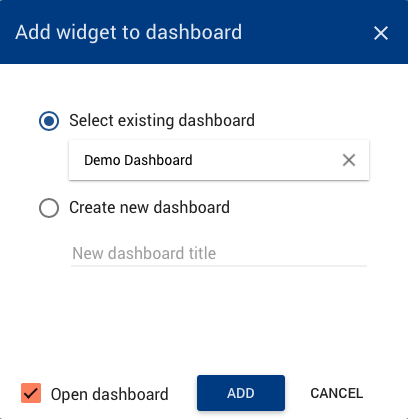
Tick the Open Dashboard checkbox as well.
Click ADD
The 2 Widgets that were created in the steps above should now be shown.